Diagrams
The diagram-page is located at admin->diagrams. LIMBAS offers the user two ways to create diagrams:
- By using your own template
- By using the LIMBAS diagram editor
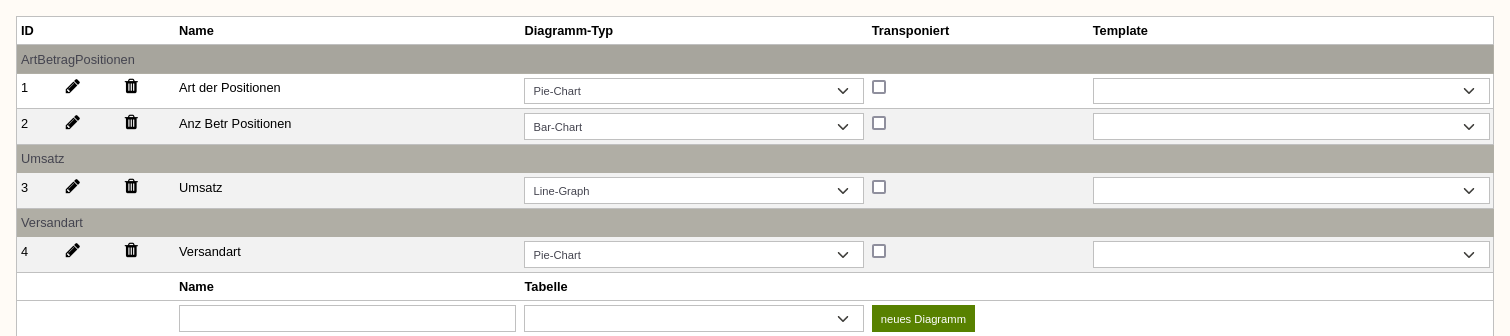
Fig.1: Diagrams
Custom Template
You have to select a file from the extensions as template which displays the diagram on its own.
LIMBAS Diagram Editor
The diagram editor is a new feature in LIMBAS.
For using it the most efficient way, you should select a Query as linked table/query.
The diagram editor can also work with normal tables though.
When using the diagram editor, you are not allowed to select a template!
Diagram Types
3 different diagram types are available at the moment:
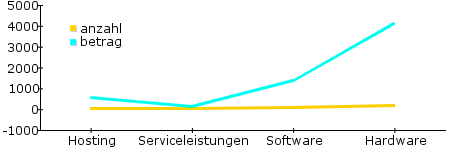
- Line-Graph
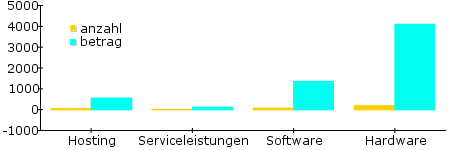
- Bar-Chart
- Pie-Chart
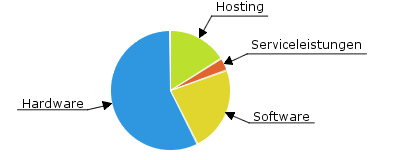
Diagram Modes
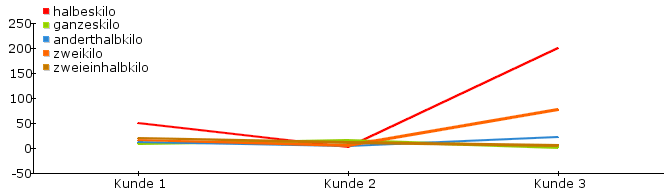
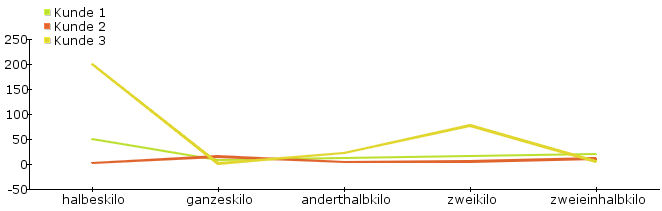
In addition to the normal way of creating a diagram out of a table/query, the user can create the diagram transposed. Columns will be used as rows and vice versa. The column headers will be used as labels. The data of this table

lead to following diagrams:
- normal
- transposed
Editing a Diagram
By clicking on the edit-symbol, the diagram editor is shown:
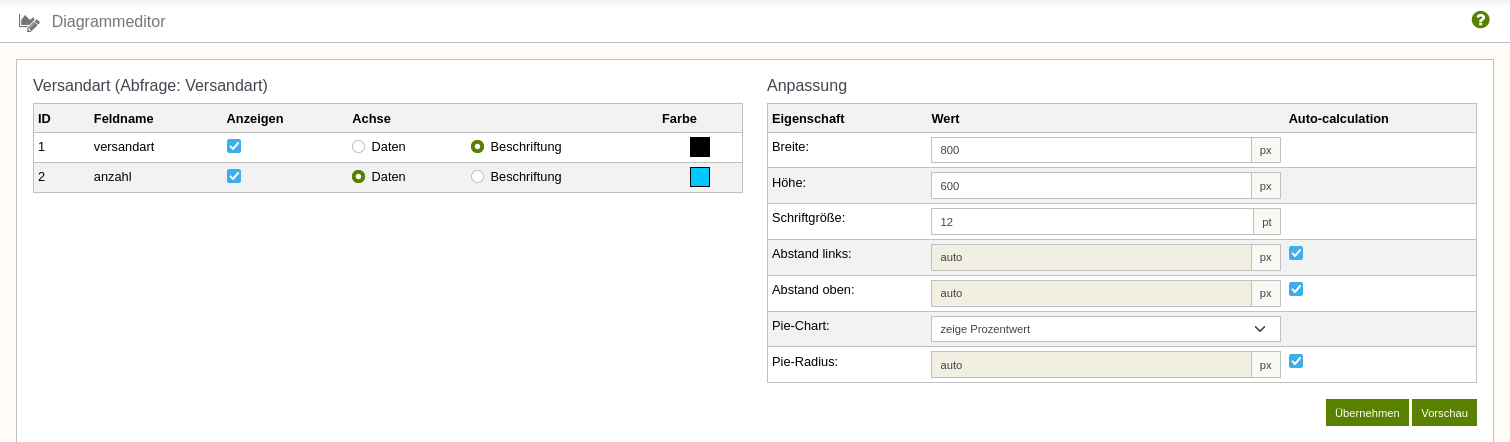
Fig.8: Editing a diagram
Field Selection
On the left, you see the data fields of the selected table with some settings:
- Show: Fields will be shown/not shown in the diagram
- Axis:
- Data: Data of this field will be shown as values
- Description: Data of this field will be shown as description (if possible)
- Color: The color of the field (if possible)
For successfully creating a diagram, the number of different axes must be correct:
- Line-Graph / Bar-Chart:
- minimum one data-axis
- maximum one description-axis
- Pie-Chart (normal):
- exactly one data-axis
- maximum one description-axis
- Pie-Chart (transposed):
- minimum one data-axis
- no description-axis
Visual Customization
On the right, you can see additional graphical settings. Not all settings are available for every diagram type:
| Attribute | Description | Line-Graph | Bar-Chart | Pie-Chart |
|---|---|---|---|---|
| Width | Width of the diagram in px | yes | yes | yes |
| Height | Height of the diagram in px | yes | yes | yes |
| Fontsize | Fontsize of the diagram in pt | yes | yes | yes |
| Top/Left gap | Gap between the diagram itself and the top/left border of the image | yes | yes | yes |
| Right/Bottom gap | Gap between the diagram itself and the right/bottom border of the image | yes | yes | no |
| Text x/y | Text to use as description of x/y axis | yes | yes | no |
| Legend x/y | Position of the legend in px | yes | yes | no |
| Legend | View of the legend: hide or vertical/horizontal align | yes | yes | no |
| Pie-Chart-Values | Hide/Show the values after the slice description or show the percentage | no | no | yes |
| Pie-Radius | The radius of the pie in px | no | no | yes |
After clicking the button below, the diagram will be shown.